IoT water monitoring: what it is and why it matters now
- 5 hours ago
- 13 min read
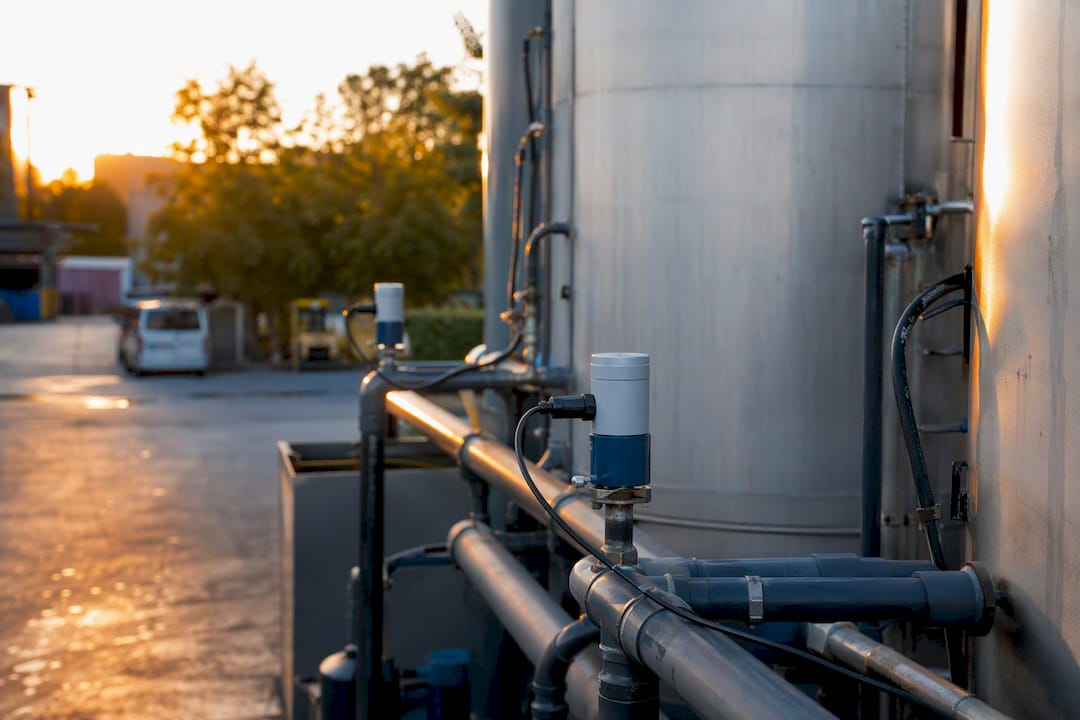
IoT water monitoring uses networked sensors, telemetry and cloud analytics to deliver continuous, auditable data on water quality and flow, so environmental teams catch problems hours or days before a manual sample would ever flag them. A functioning system has four parts: sensors or samplers measuring determinands at the point of interest; a telemetry layer moving that data off site; a platform storing and visualising it; and an alerting engine that tells someone when a threshold is breached.
The case for adopting it comes down to three things:
Compliance-grade continuous data that stands up to audit, rather than a handful of spot samples per year
Faster incident detection, because a pH excursion or ammonia spike shows up in near real time, not weeks later in a lab report
Operational savings, from reduced leakage, tighter dosing control and fewer emergency call-outs
Utilities and large site operators that combine remote water quality monitoring with proper operational follow-up report measurable falls in water loss and consumption, though the size of that saving depends heavily on the site and how well staff act on the alerts, not just the sensors installed.
Key Takeaways
IoT water monitoring works when sensor choice, telemetry design and maintenance discipline are matched to a site’s actual risk profile and regulatory obligations.
Point | Details |
Match determinands to risk | Prioritise pH, turbidity, dissolved oxygen, conductivity and ammonia based on what’s actually at stake on site, not a generic checklist. |
Certification protects you | MCERTS and EN 16479:2023 give independent proof that a sampler or monitor performs as claimed, which matters for audits. |
Connectivity shapes reliability | LoRaWAN suits remote, low-power sites; cellular options suit higher-frequency reporting needs; hybrid designs with local buffering survive outages. |
Maintenance is the real cost | Fouling, drift and calibration cadence determine data quality far more than the sensor’s specification sheet. |
Staff and procedure close the loop | Alerts only deliver value when someone is trained, resourced and ready to act on them. |
Table of Contents
Connectivity and architecture: telemetry choices and network design
Use cases: flow, level, leak detection and open-water quality monitoring
Design, durability and maintenance: making systems last in wet environments
Data platforms, analytics and alerts: from DAHS/SCADA to cloud dashboards and APIs
UK regulatory and standards landscape relevant to continuous monitoring
Practical checklist and client proof points from Bespoke Compliance Solutions
Data security and privacy considerations in IoT water monitoring systems
Integration with existing water management infrastructure and legacy systems
Cost analysis and budgeting for IoT water monitoring deployments
Why compliance-first thinking beats technology-first thinking
Sensors and sampling: which determinands to measure and how
Six determinands cover most operational and regulatory needs: pH, temperature, turbidity, dissolved oxygen, conductivity or total dissolved solids (TDS), and ammoniacal nitrogen. Each tells you something different, and prioritising the wrong one wastes budget.
pH and temperature are cheap, stable and worth monitoring almost everywhere as a baseline health check
Turbidity flags sediment disturbance, storm impact or treatment failure fast, often before other parameters move
Dissolved oxygen matters most where ecological impact or sewage discharge is a risk, since it collapses quickly during pollution events
Conductivity/TDS is a cheap proxy for salinity intrusion or industrial discharge
Ammoniacal nitrogen is the hardest to measure continuously and the one regulators care about most for sewage-related risk
The core decision is continuous sensors versus automatic samplers. Continuous probes (optical, electrochemical or ion-selective) give you a data point every few minutes and are what near real time reporting depends on. Automatic samplers collect discrete or composite samples for later lab analysis, and they remain the gold standard for parameters continuous sensors cannot reliably capture at low cost. EN 16479:2023 sets the performance requirements that automatic samplers must meet for regulatory use, and MCERTS certification against that standard is what most UK procurement specifications now demand.
Fouling and drift are the two failure modes that quietly ruin a dataset. Optical sensors accumulate biofilm within weeks in nutrient-rich water; electrochemical probes drift as membranes age. Calibration frequency should be driven by site conditions, not a generic schedule.
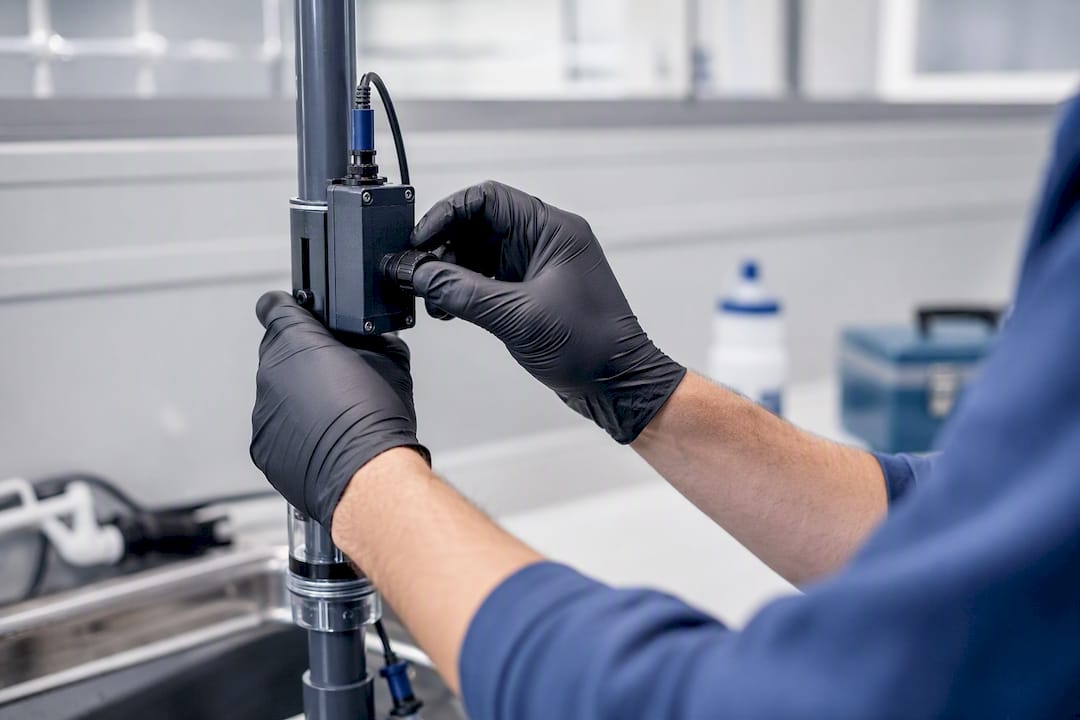
Pro Tip: Log every calibration event with a timestamp and the reference standard used. When an auditor questions a data gap, that log is what turns an awkward conversation into a five-minute explanation.
Connectivity and architecture: telemetry choices and network design
The network layer decides whether your data arrives in time to act on it, or turns up as a historical curiosity. Three connectivity families dominate water IoT sensors deployments, and each suits a different site profile.
LoRaWAN offers long range and very low power draw, making it the default choice for remote sites with weak cellular coverage; a systematic review of IoT strategies for surface and groundwater monitoring found it the most widely adopted transmission technology in the sector
NB-IoT and LTE-M trade some battery life for higher bandwidth and easier integration with existing mobile networks, useful where you need more frequent uploads
Satellite covers sites with no terrestrial coverage at all, at a higher cost per byte and with more latency
Most credible lorawan water monitoring deployments now use a hybrid pattern: a local gateway aggregates readings from several sensors, buffers data locally during a network outage, and fails over to a secondary path (often cellular) if the primary link drops. That buffering matters more than people expect. A gateway that stores 48 hours locally survives most short outages without losing a single reading.
Telemetry also needs to support interval switching, sending readings hourly under normal conditions but stepping up to every 15 minutes during a pollution event or storm. Power planning follows from this: battery-only nodes suit low-frequency reporting, solar-assisted units suit continuous high-frequency sites, and mains power remains the only realistic option for gateways running always-on cellular backhaul.
Use cases: flow, level, leak detection and open-water quality monitoring
IoT water monitoring earns its budget fastest when it’s mapped against a specific operational problem rather than deployed as a generic upgrade.
Flow and metering. Clamp-on and insertion electromagnetic flowmeters suit retrofit projects where cutting into a pipe isn’t practical, while ultrasonic flowmeters work well for billing-grade accuracy on larger mains. Pairing flow data with consumption baselines is how leakage gets caught before it shows up on a bill.
Level and tank monitoring. Submersible pressure sensors and non-contact ultrasonic units both track reservoir and tank levels reliably; ultrasonic tends to win where fouling or corrosive contents make submersion risky.
Open-water quality monitoring. Siting is everything here. A probe placed too close to a mixing point after a discharge gives a misleading average; bank-mounted sensors are easier to service but can miss mid-channel variation that an in-channel deployment catches.
Building and infrastructure leak detection. Acoustic and flow-anomaly sensors on internal pipework catch slow leaks that never trip a burst-pipe alarm but quietly inflate water bills for months. A modular IoT architecture combining flowmeters, water quality units and LoRaWAN connectivity has been piloted specifically to make this kind of building-level water usage tracking system affordable at scale.
Design, durability and maintenance: making systems last in wet environments
A sensor that performs beautifully on the bench and fails within three months in the field isn’t a bargain, whatever it cost. Ingress protection rated at IP68 is the realistic minimum for anything submerged or exposed to spray, and housings need materials that resist the specific corrosive profile of the site, chlorinated water, brackish estuarine conditions and raw sewage all attack differently.
Fit anti-fouling measures (wipers, copper alloy shields, ultrasonic anti-biofilm units) wherever nutrient loading is high
Set calibration cadence by determinand risk, monthly for optical turbidity in eutrophic water, quarterly for stable pH probes in clean supply
Document every calibration, service visit and sensor swap against a fixed template so records read consistently across a multi-site estate
Build remote diagnostics into the platform so a flatlining signal triggers a maintenance ticket before anyone notices the gap manually
Hold a small spares inventory for common failure parts (membranes, wipers, batteries) rather than waiting on supplier lead times
Pro Tip: Treat every sensor outage as a data quality event, not just an equipment fault. A timestamped flag showing “instrument offline” protects your dataset’s credibility far better than a silent gap that someone has to explain months later.
Data platforms, analytics and alerts: from DAHS/SCADA to cloud dashboards and APIs
Raw readings are worthless until something turns them into a decision. Data Acquisition and Handling Systems (DAHS) and SCADA remain the backbone for regulated sites, while cloud dashboards increasingly sit alongside them for visualisation and cross-site reporting. The EN 17255 family of standards sets out what a compliant DAHS needs to do, including permanent storage and quality assurance procedures, and it’s worth checking any platform you’re evaluating against those requirements before committing.
Retain raw and validated data separately, with full metadata on calibration state and any manual edits
Keep an audit trail that shows who changed what and when, non-negotiable for anything feeding a regulatory return
Use baseline modelling to understand normal seasonal variation before setting alert thresholds, otherwise every spring thaw trips a false alarm
Treat machine learning-based anomaly detection as a decision-support layer, not a replacement for a human reviewing genuine excursions
API access matters more than most procurement documents make it sound. If your platform can’t expose data to a third-party asset management system, you end up manually re-entering figures that already exist, which defeats much of the point of automating the collection in the first place.
UK regulatory and standards landscape relevant to continuous monitoring
The Environment Act 2021 introduced duties under section 141DB requiring continuous water quality monitoring at sewage treatment works, and the resulting Continuous Water Quality Monitoring (CWQM) programme is now the reference point for anyone building a compliant system in England.
The CWQM interim technical standard specifies minimum determinands, dissolved oxygen, temperature, pH, turbidity and ammonia, alongside near-real-time publication and API data access
MCERTS certification applies to both continuous water monitors and automatic samplers, and performance standards for continuous water monitoring equipment define the determinand ranges and test procedures certification is measured against
Interval switching is a hard operational requirement, not a nice-to-have: baseline readings on an hourly cycle, stepping to 15 minutes during elevated risk periods, with remote switching supported by the telemetry layer
Continuous ammonia measurement remains the most technically demanding determinand on the CWQM list. Where sensor technology can’t yet deliver reliable continuous ammonia readings at the required accuracy, operators are expected to manage derived parameters and document the limitation rather than quietly ignore it.
Certification exists precisely because self-declared accuracy claims from manufacturers vary wildly in practice. A monitor that hasn’t been through MCERTS testing might work perfectly, but you have no independent evidence of that until it’s already feeding a regulatory return.
Implementation roadmap: assess, pilot, validate, scale
Rolling out smart water management infrastructure without a staged plan is how organisations end up with expensive sensors nobody trusts.
Assess. Define the objectives, list stakeholders, and map which sites and determinands carry the highest risk. This is where the priority list gets built, not adjusted later.
Pilot. Choose a representative sensor mix, test the telemetry path under real site conditions, and cross-check every automated reading against reference sampling and lab analysis for at least one full seasonal cycle.
Validate. Lock down calibration records, write maintenance standard operating procedures, train the staff who’ll act on alerts, and build an incident playbook before you need one.
Scale. Move to formal procurement, negotiate service contracts with clear response times, set KPI targets, and integrate outputs into the existing asset management system.
Pro Tip: Run the pilot for a full year if the site has seasonal variation. A six-week trial in summer tells you almost nothing about how the system behaves during a winter storm surge.
Technology is only half the solution. Matching sensors to an honest risk map, training staff properly, and having a clear procedure for acting on an alert matters as much as any sensor specification.
Practical checklist and client proof points from Bespoke Compliance Solutions
Bespokecompliancesolutions approaches automated monitoring the same way we approach every water hygiene programme: compliance-first, site-specific, and built to survive an audit.
Run a site survey and build a determinand matrix before choosing any hardware
Decide continuous sensor versus automatic sampler per parameter, not as a blanket policy
Document QA/QC procedures alongside every calibration and maintenance visit
Fold monitoring outputs directly into Legionella and water hygiene control programmes, rather than running them as a separate system
We’ve applied this thinking through our work on automated temperature monitoring for Legionella checks, where continuous data replaces manual spot checks across multi-site estates. The same logic in our guidance on completing temperature monitoring checks for Legionella compliance applies equally to broader water quality telemetry: the data is only as good as the procedure built around it.
Data security and privacy considerations in IoT water monitoring systems
A sensor network transmitting compliance data is also a network that could be tampered with, spoofed, or simply left unencrypted by default. Treat security as part of the specification, not an afterthought bolted on after procurement.
Encrypt data in transit between sensor, gateway and platform, and insist on encryption at rest for anything stored in the cloud. LoRaWAN networks support AES-128 encryption at the application layer, but it has to be configured correctly, a surprising number of deployments run with default keys because nobody changed them during commissioning.
Access control matters as much as encryption. Not every stakeholder needs write access to calibration settings or alert thresholds; most only need read access to dashboards. Segment permissions by role, and keep an audit log of who changed a threshold or exported a dataset, since that log becomes essential if data integrity is ever challenged during a regulatory investigation.
Physical security is easy to overlook. A gateway sitting in an unlocked cabinet on a remote site is vulnerable to tampering that no amount of software encryption fixes. Where sites are public-facing or unstaffed, physically secure the hardware and consider tamper alerts on the enclosure itself.
Data privacy considerations grow once a network expands beyond pure environmental readings into building occupancy or usage patterns inferred from flow data. Even where the raw data isn’t personal, aggregated usage patterns from a housing association’s water usage tracking system can reveal occupancy behaviour. Treat that inference risk seriously in any data-sharing agreement with a third party.
Integration with existing water management infrastructure and legacy systems
Very few sites start with a blank slate. Most environmental managers are adding IoT capability to a mix of ageing SCADA installations, spreadsheet-based logging, and the occasional standalone data logger nobody fully documented when it was installed. The integration question, not the sensor question, is usually what determines whether a project succeeds.
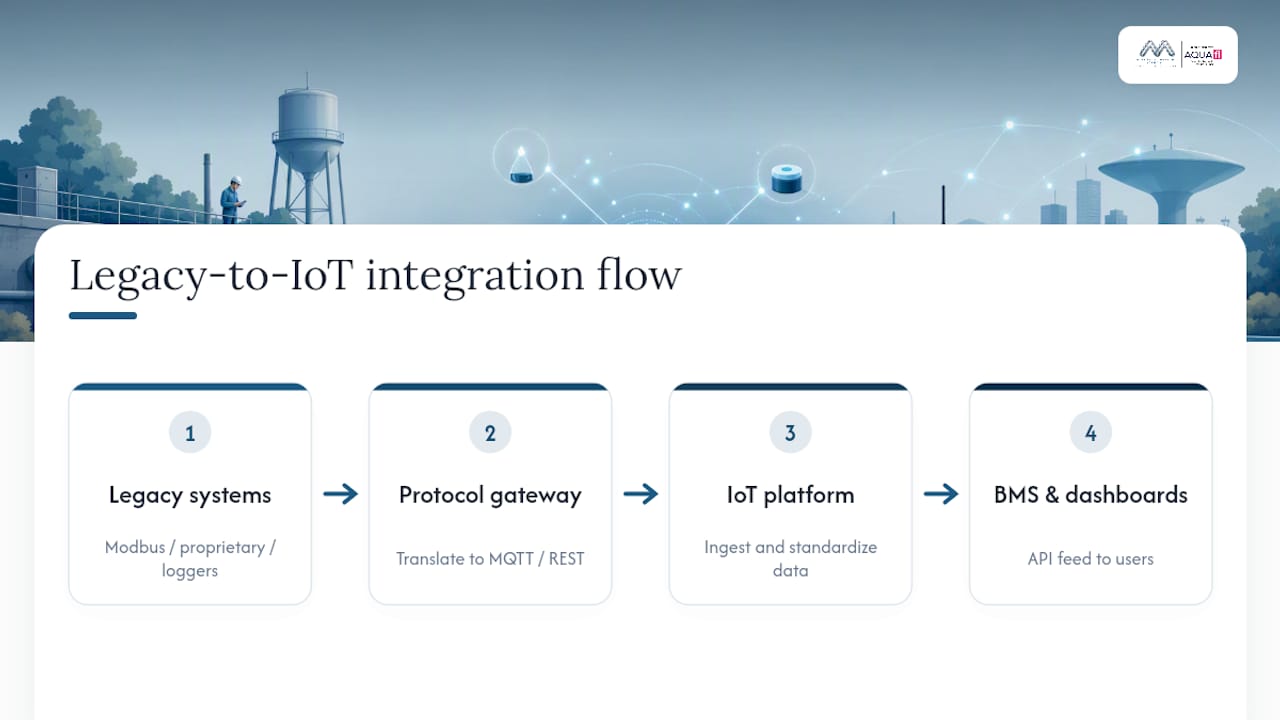
Legacy SCADA systems often communicate over Modbus or older proprietary protocols that modern IoT platforms weren’t built to speak natively. Gateway devices that translate between old protocols and modern MQTT or REST APIs bridge that gap without ripping out infrastructure that still works perfectly well mechanically. Replacing a functioning SCADA backbone purely to add IoT sensors is rarely the right call when a translation layer solves the same problem for a fraction of the cost.
Comparing bms vs iot monitoring approaches often misses the real answer: they’re complementary, not competing. A building management system (BMS) typically handles heating, ventilation and mechanical plant control on a fixed schedule; IoT water sensors add a continuous, granular quality and flow layer that most BMS platforms were never designed to capture. The practical move is usually to feed IoT data into the BMS or asset management platform via API, rather than treating either system as a replacement for the other.
Data format consistency is the unglamorous detail that derails more integrations than any hardware fault. Agree a common timestamp standard, unit convention and determinand naming scheme across every legacy and new system before data starts flowing, retrofitting consistency after the fact costs far more than establishing it up front.
Cost analysis and budgeting for IoT water monitoring deployments
Budgeting for automated irrigation monitoring or continuous water quality monitoring involves more moving costs than the headline sensor price suggests, and treating hardware as the only line item is the most common budgeting mistake we see.
Sensor and sampler hardware is genuinely the smallest recurring cost over a system’s lifetime. The bigger long-term spend sits in connectivity fees (cellular data plans in particular), calibration consumables, planned maintenance visits, and the platform subscription or licensing fee for data storage and analytics. A LoRaWAN network with owned gateway infrastructure carries lower ongoing connectivity costs than a cellular-based NB-IoT or LTE-M deployment, but it demands more upfront capital and in-house technical capacity to maintain the gateway network itself.
Staff time is the cost most budgets underestimate. Someone has to review dashboards, respond to alerts, and carry out physical maintenance visits, and that role doesn’t disappear just because the sensors are automated. A system with excellent hardware and no allocated staff time to act on its output delivers a very expensive stream of ignored notifications.
Phasing spend across a pilot, then a scaled rollout, spreads risk sensibly. A pilot on your highest-risk sites validates sensor choice and telemetry reliability before you commit to a full estate rollout, and it gives procurement a realistic total cost of ownership figure rather than a vendor’s best-case quote. Factor in a contingency for consumables and unplanned repairs, fouling and storm damage happen on a timeline nobody’s spreadsheet predicts.
Why compliance-first thinking beats technology-first thinking
Most guidance on this subject starts with sensor specifications and works backwards to compliance. That order is wrong. The organisations that get real value from continuous monitoring start with the regulatory question, what does CWQM or MCERTS actually require us to prove, and then select hardware that answers it.
The overrated part of this whole field is the sensor itself. Everyone obsesses over accuracy specs and detection limits, and reasonably so, but the research on modular IoT pilots and the systematic reviews of deployment strategies both point to the same underappreciated truth: architecture and maintenance discipline determine whether a system delivers usable data for years, not the sensor’s datasheet.
If you take one thing from this guide, prioritise the audit trail before the analytics dashboard. A beautiful dashboard built on data nobody can defend under scrutiny is worse than no dashboard at all, because it creates false confidence. Get the calibration records, the metadata and the QA procedure right first. Everything else, the machine learning, the predictive maintenance, the fancy visualisation, is genuinely useful, but only once the foundation is trustworthy.
Sources
For procurement and certification, consult MCERTS guidance for automatic water sampling equipment, the CWQM interim technical standard, and MCERTS DAHS standards.
FAQ
What is an IoT water monitoring system?
It’s a network of connected sensors that measure water quality or flow determinands and transmit readings via telemetry (such as LoRaWAN or cellular) to a cloud or SCADA platform for real-time analysis and alerting.
What is an IoT monitoring system, generally?
An IoT monitoring system combines physical sensors, a connectivity layer, and a software platform to collect, transmit and analyse data automatically, without requiring someone to manually record a reading on site.
What are some examples of IoT devices used in water monitoring?
Common examples include continuous pH and turbidity probes, dissolved oxygen sensors, ultrasonic level sensors, clamp-on flowmeters, and LoRaWAN telemetry gateways that relay readings to a central platform.
What is an IoT-based water level sensor?
It’s typically a submersible pressure sensor or a non-contact ultrasonic device that measures water depth in a tank, reservoir or channel and transmits that reading via a wireless network for remote monitoring and alerting.
Recommended
Comments